Want to optimize your PHP application’s memory usage? The memory_get_peak_usage() function is your go-to tool for identifying peak memory consumption and improving performance. This guide covers everything you need to know, from basic usage to advanced tips.
Key Takeaways:
- What it does: Tracks the highest memory usage during script execution.
- Why it matters: Helps prevent crashes, reduce costs, and improve scalability.
- How to use it:
- Use
memory_get_peak_usage(false)for PHP-specific memory. - Use
memory_get_peak_usage(true)for total system memory.
- Use
- Comparison: Unlike
memory_get_usage(), this function tracks peak usage, ideal for spotting bottlenecks. - Optimization tips: Monitor high-memory operations, use lazy loading, and balance memory with performance.
Quick Example:
$peakMemory = memory_get_peak_usage(true);
echo "Peak Memory Usage: " . ($peakMemory / 1024 / 1024) . " MB";
Ready to dive deeper? Learn how to monitor, analyze, and optimize your PHP application’s memory usage effectively.
Mastering Memory Profiling in PHP: Streamline Your Insights
Understanding memory_get_peak_usage()
The memory_get_peak_usage() function shows the highest amount of memory your PHP script used during its execution. Here’s a closer look at how it works.
Depending on the parameter you pass, the function measures memory usage differently:
| Parameter Value | What It Measures | When to Use |
|---|---|---|
false (default) |
Memory allocated by PHP internally (via emalloc) | Debugging during development |
true |
Total memory allocated by the system | Monitoring in production environments |
Return Value and Conversion
The function returns the memory usage in bytes. To make this more readable, developers often convert it to megabytes. Here’s an example:
$peakMemory = memory_get_peak_usage(true);
$peakMemoryMB = round($peakMemory / 1024 / 1024, 2);
How It Differs from memory_get_usage()
Though both memory_get_peak_usage() and memory_get_usage() track memory, they serve different purposes:
| Function | What It Tracks | Ideal For |
|---|---|---|
memory_get_peak_usage() |
Peak memory usage during execution | Spotting memory bottlenecks |
memory_get_usage() |
Current memory usage at the time of the call | Real-time memory checks |
The key difference is when they measure memory. memory_get_peak_usage() logs the highest memory usage during the script’s run, which is helpful for identifying heavy memory operations. On the other hand, memory_get_usage() gives you a snapshot of memory usage at a specific moment, making it useful for tracking live memory consumption. Both tools are invaluable for optimizing PHP applications.
Using memory_get_peak_usage() effectively
Now that we’ve covered the syntax basics, let’s dive into practical ways to monitor memory usage in PHP.
Basic usage example
Here’s a simple script to compare memory usage at different stages:
<?php
// Start of script
echo "Initial peak memory usage: " . memory_get_peak_usage(true) . " bytes\n";

// Perform some memory-intensive operations
$array = range(0, 100000);
$string = str_repeat("Hello", 1000);

// Check peak memory usage after operations
echo "Peak memory usage after operations: " . memory_get_peak_usage(true) . " bytes\n";

// Free up memory
unset($array);
unset($string);

// Check final peak memory usage
echo "Final peak memory usage: " . memory_get_peak_usage(true) . " bytes\n";
?>
This provides a straightforward way to measure memory consumption and establish benchmarks for optimization.
Monitoring memory usage in real-time
To make memory tracking more efficient, you can create a reusable function:
function logMemoryUsage($label) {
    $memory = memory_get_peak_usage(true);
    $formatted = number_format($memory / 1024 / 1024, 2) . ' MB';
    echo "{$label}: {$formatted}\n";
}
Use this function throughout your code to monitor memory usage at key points:
logMemoryUsage("Start of script");
$data = array_fill(0, 100000, 'test');
logMemoryUsage("After creating large array");
$data = null;
logMemoryUsage("After nullifying array");
This approach helps pinpoint memory spikes and track how your code impacts resource consumption.
Analyzing results for insights
To make the most of your data, focus on these steps:
- Establish a baseline for memory usage.
- Spot unexpected spikes or irregularities.
- Compare patterns across multiple runs.
- Maintain a consistent testing environment.
- Run tests repeatedly to ensure reliable results.
- Consider external factors, like background processes.
“Understanding peak memory usage is crucial for optimizing PHP applications, especially in high-traffic environments where every byte counts.”
For deeper analysis, combine memory_get_peak_usage() with other memory-related functions. Here’s an example:
function memoryProfile($label) {
    $currentUsage = memory_get_usage(true);
    $peakUsage = memory_get_peak_usage(true);
    $memoryLimit = ini_get('memory_limit');

    echo "{$label}:\n";
    echo "Current Usage: " . number_format($currentUsage / 1024 / 1024, 2) . " MB\n";
    echo "Peak Usage: " . number_format($peakUsage / 1024 / 1024, 2) . " MB\n";
    echo "Memory Limit: {$memoryLimit}\n\n";
}
This function provides a snapshot of current and peak memory usage, along with the memory limit, giving you a more complete picture of your application’s resource demands.
Best practices for memory profiling in PHP
When to use memory_get_peak_usage()
memory_get_peak_usage() can be a helpful tool in several scenarios:
- During performance tuning to pinpoint areas of code that use excessive memory and may need adjustments.
- While debugging to track down potential memory leaks in your application.
- For resource planning in systems that operate under tight memory limits.
- To compare algorithms and determine which implementation is more efficient in terms of memory usage.
Using with other memory functions
Here’s an example of how you can combine memory_get_peak_usage() with other memory-related functions to track and display memory usage:
function memorySnapshot($label) {
    $current = memory_get_usage(true);
    $peak = memory_get_peak_usage(true);
    $limit = ini_get('memory_limit');

    echo sprintf(
        "%s:\nCurrent: %.2f MB\nPeak: %.2f MB\nLimit: %s\n",
        $label,
        $current / 1024 / 1024,
        $peak / 1024 / 1024,
        $limit
    );

    // Reset peak memory tracking for the next section
    memory_reset_peak_usage();
}
This function provides a quick snapshot of the current memory usage, peak usage, and memory limit, making it easier to analyze memory behavior during execution.
Ensuring accurate measurements
To get precise memory usage data, follow these steps:
Before measuring:
- Clear opcode caches to avoid interference.
- Disable any extensions that aren’t needed for the test.
- Run tests in isolated processes to minimize external factors.
When measuring:
- Use
real_usage=trueto get a more accurate picture of actual memory allocated. - Call
gc_collect_cycles()to clear any unreferenced objects before measurement. - Perform multiple runs and calculate the average to account for variability.
Keep in mind that PHP allocates memory in chunks, which can influence how you interpret the results.
sbb-itb-f1cefd0
Optimizing Applications Based on Peak Memory Usage
Identifying High-Memory Operations
To tackle memory usage, start by implementing memory logging around operations you suspect to be resource-heavy. Some common culprits include:
- Handling large datasets or arrays
- Performing image processing tasks
- Parsing complex XML files
- Running inefficient database queries
- Creating large objects repeatedly in loops
You can use memory checkpoints to monitor these operations effectively. For example:
function logMemoryUsage($label) {
    $memory = memory_get_peak_usage(true);
    error_log(sprintf("[%s] Memory usage: %s", $label, number_format($memory)));
}

logMemoryUsage("Before operation");
// Perform the memory-intensive operation
logMemoryUsage("After operation");
This approach helps pinpoint areas needing optimization.
Reducing Memory Consumption
Here’s a practical way to optimize memory usage. Instead of loading all data upfront, consider lazy loading, as shown below:
class Product {
    private $id;
    private $data = null;

    public function __construct($id) {
        $this->id = $id;
    }

    public function getName() {
        $this->loadData();
        return $this->data['name'];
    }

    private function loadData() {
        if ($this->data === null) {
            $this->data = Database::query("SELECT * FROM products WHERE id = ?", [$this->id])->fetch();
        }
    }
}
This method ensures data is only fetched when needed, reducing unnecessary memory use.
Balancing Performance and Memory
When optimizing, always weigh memory savings against performance trade-offs. Here’s a quick comparison:
| Optimization Technique | Memory Reduction | Performance Impact |
|---|---|---|
| Lazy Loading | 20-40% | Minimal latency increase |
| Query Optimization | 10-30% | Faster response times |
| Generators | 50-90% | Reduced initial load time |
These strategies can help strike a balance between efficiency and speed.
Using Inspector for Better Memory Monitoring
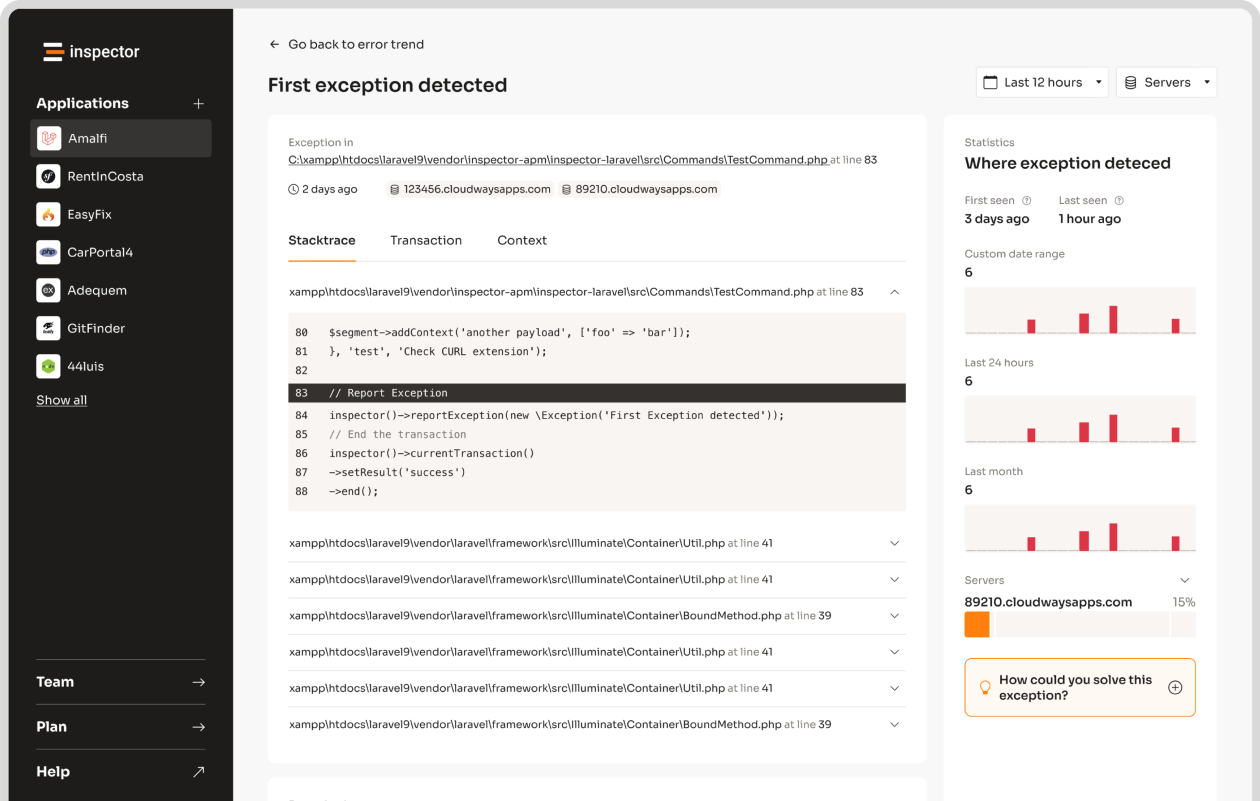
What is Inspector?
Inspector provides you with continuous monitoring on your application execution cycles. It helps track trends, uncover hidden memory leaks, and offers real-time insights. Installation is simple – just two lines via Composer. It works seamlessly with frameworks like Laravel, Symfony, and CodeIgniter. Features include:
- Real-time memory tracking
- Detection of memory leaks
- Component-level usage breakdowns
- Alerts when memory thresholds are crossed
Using Inspector for Memory Profiling
Here’s how you can use Inspector to monitor memory usage in your application:
$inspector = new \Inspector\Inspector(
    new \Inspector\Configuration('INGESTION-KEY')
);

$inspector->startTransaction('DataProcessing');

// Your script here...

$inspector->transaction()->end();
Inspector provides a detailed timeline of memory usage, making it easier to:
- Spot sudden memory spikes or anomalies
- Identify patterns across different parts of your application
- Link memory consumption to slow database queries
- Get notified when memory usage exceeds predefined limits
Conclusion
Performance optimization remains a top priority for developers, as seen in industry surveys. Tools like memory_get_peak_usage() play a crucial role by identifying memory-heavy operations. Setting optimization goals is most effective when guided by thorough benchmarking.
For those ready to take action, the focus now shifts to practical strategies for improving memory usage.
Next Steps for Developers
To make the most of memory profiling in PHP applications:
- Use
memory_get_peak_usage()to monitor key execution phases consistently. - Establish baseline memory usage for critical workflows.
- Target code sections with the highest memory consumption based on peak usage data.
If you need more detailed insights, tools like Inspector can complement memory_get_peak_usage() by offering real-time data and automated alerts, making it easier to track memory usage patterns effectively.
FAQs
How to calculate memory usage in PHP?
You can use these practical methods to monitor memory usage in your PHP applications:
$currentMemory = memory_get_usage();
$peakMemoryDefault = memory_get_peak_usage();
$peakMemoryReal = memory_get_peak_usage(true);
Need a way to display memory usage in a readable format? Try this helper function:
function formatMemory($bytes, $precision = 2) {
    $units = ['B', 'KB', 'MB', 'GB', 'TB'];
    $bytes = max($bytes, 0);
    $pow = floor(($bytes ? log($bytes) : 0) / log(1024));
    $pow = min($pow, count($units) - 1);
    $bytes /= (1 << (10 * $pow));
    return round($bytes, $precision) . ' ' . $units[$pow];
}

echo "Peak Memory Usage: " . formatMemory(memory_get_peak_usage(true));
Key functions for memory tracking include:
memory_get_usage(): Tracks current memory usage in real-time.memory_get_peak_usage(): Identifies the highest memory usage during script execution.memory_get_peak_usage(true): Includes system-level memory allocation for better resource planning.
For comprehensive monitoring, combine these functions with existing patterns discussed earlier. If you’re working in memory-critical environments, tools like Inspector’s automated monitoring (referenced in section 5) can offer additional support.