


No need to learn big data stuff, install servers in the Cloud or become a master of internet security.
All you need is our Symfony package.
One of the most appreciated things of Inspector is that you don’t need to install anything at server level.
Inspector ships as a simple composer package that you can install and use in your application as any other dependency. Learn more on our Tutorial: Symfony Application Monitoring.
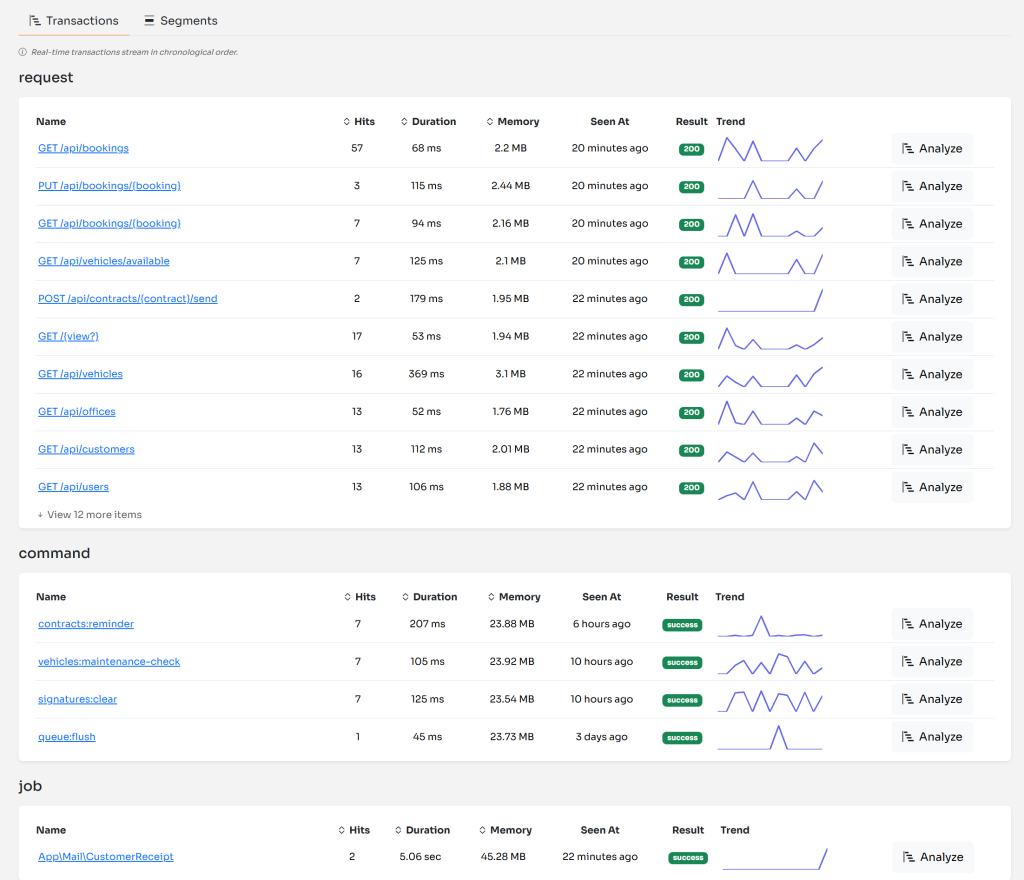
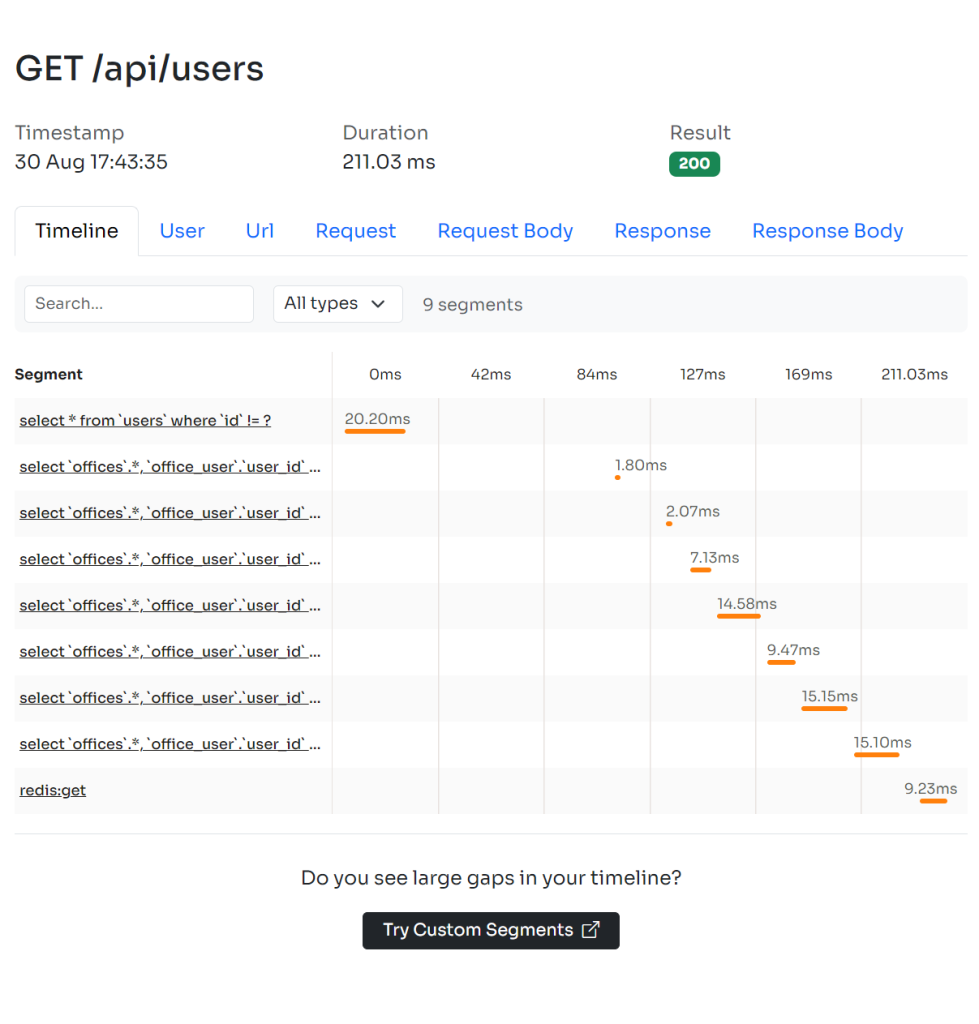
Visualize what your application is doing during HTTP requests or background tasks. You can immediately understand which statement can be optimized to make your application more efficient, and your customers happy.
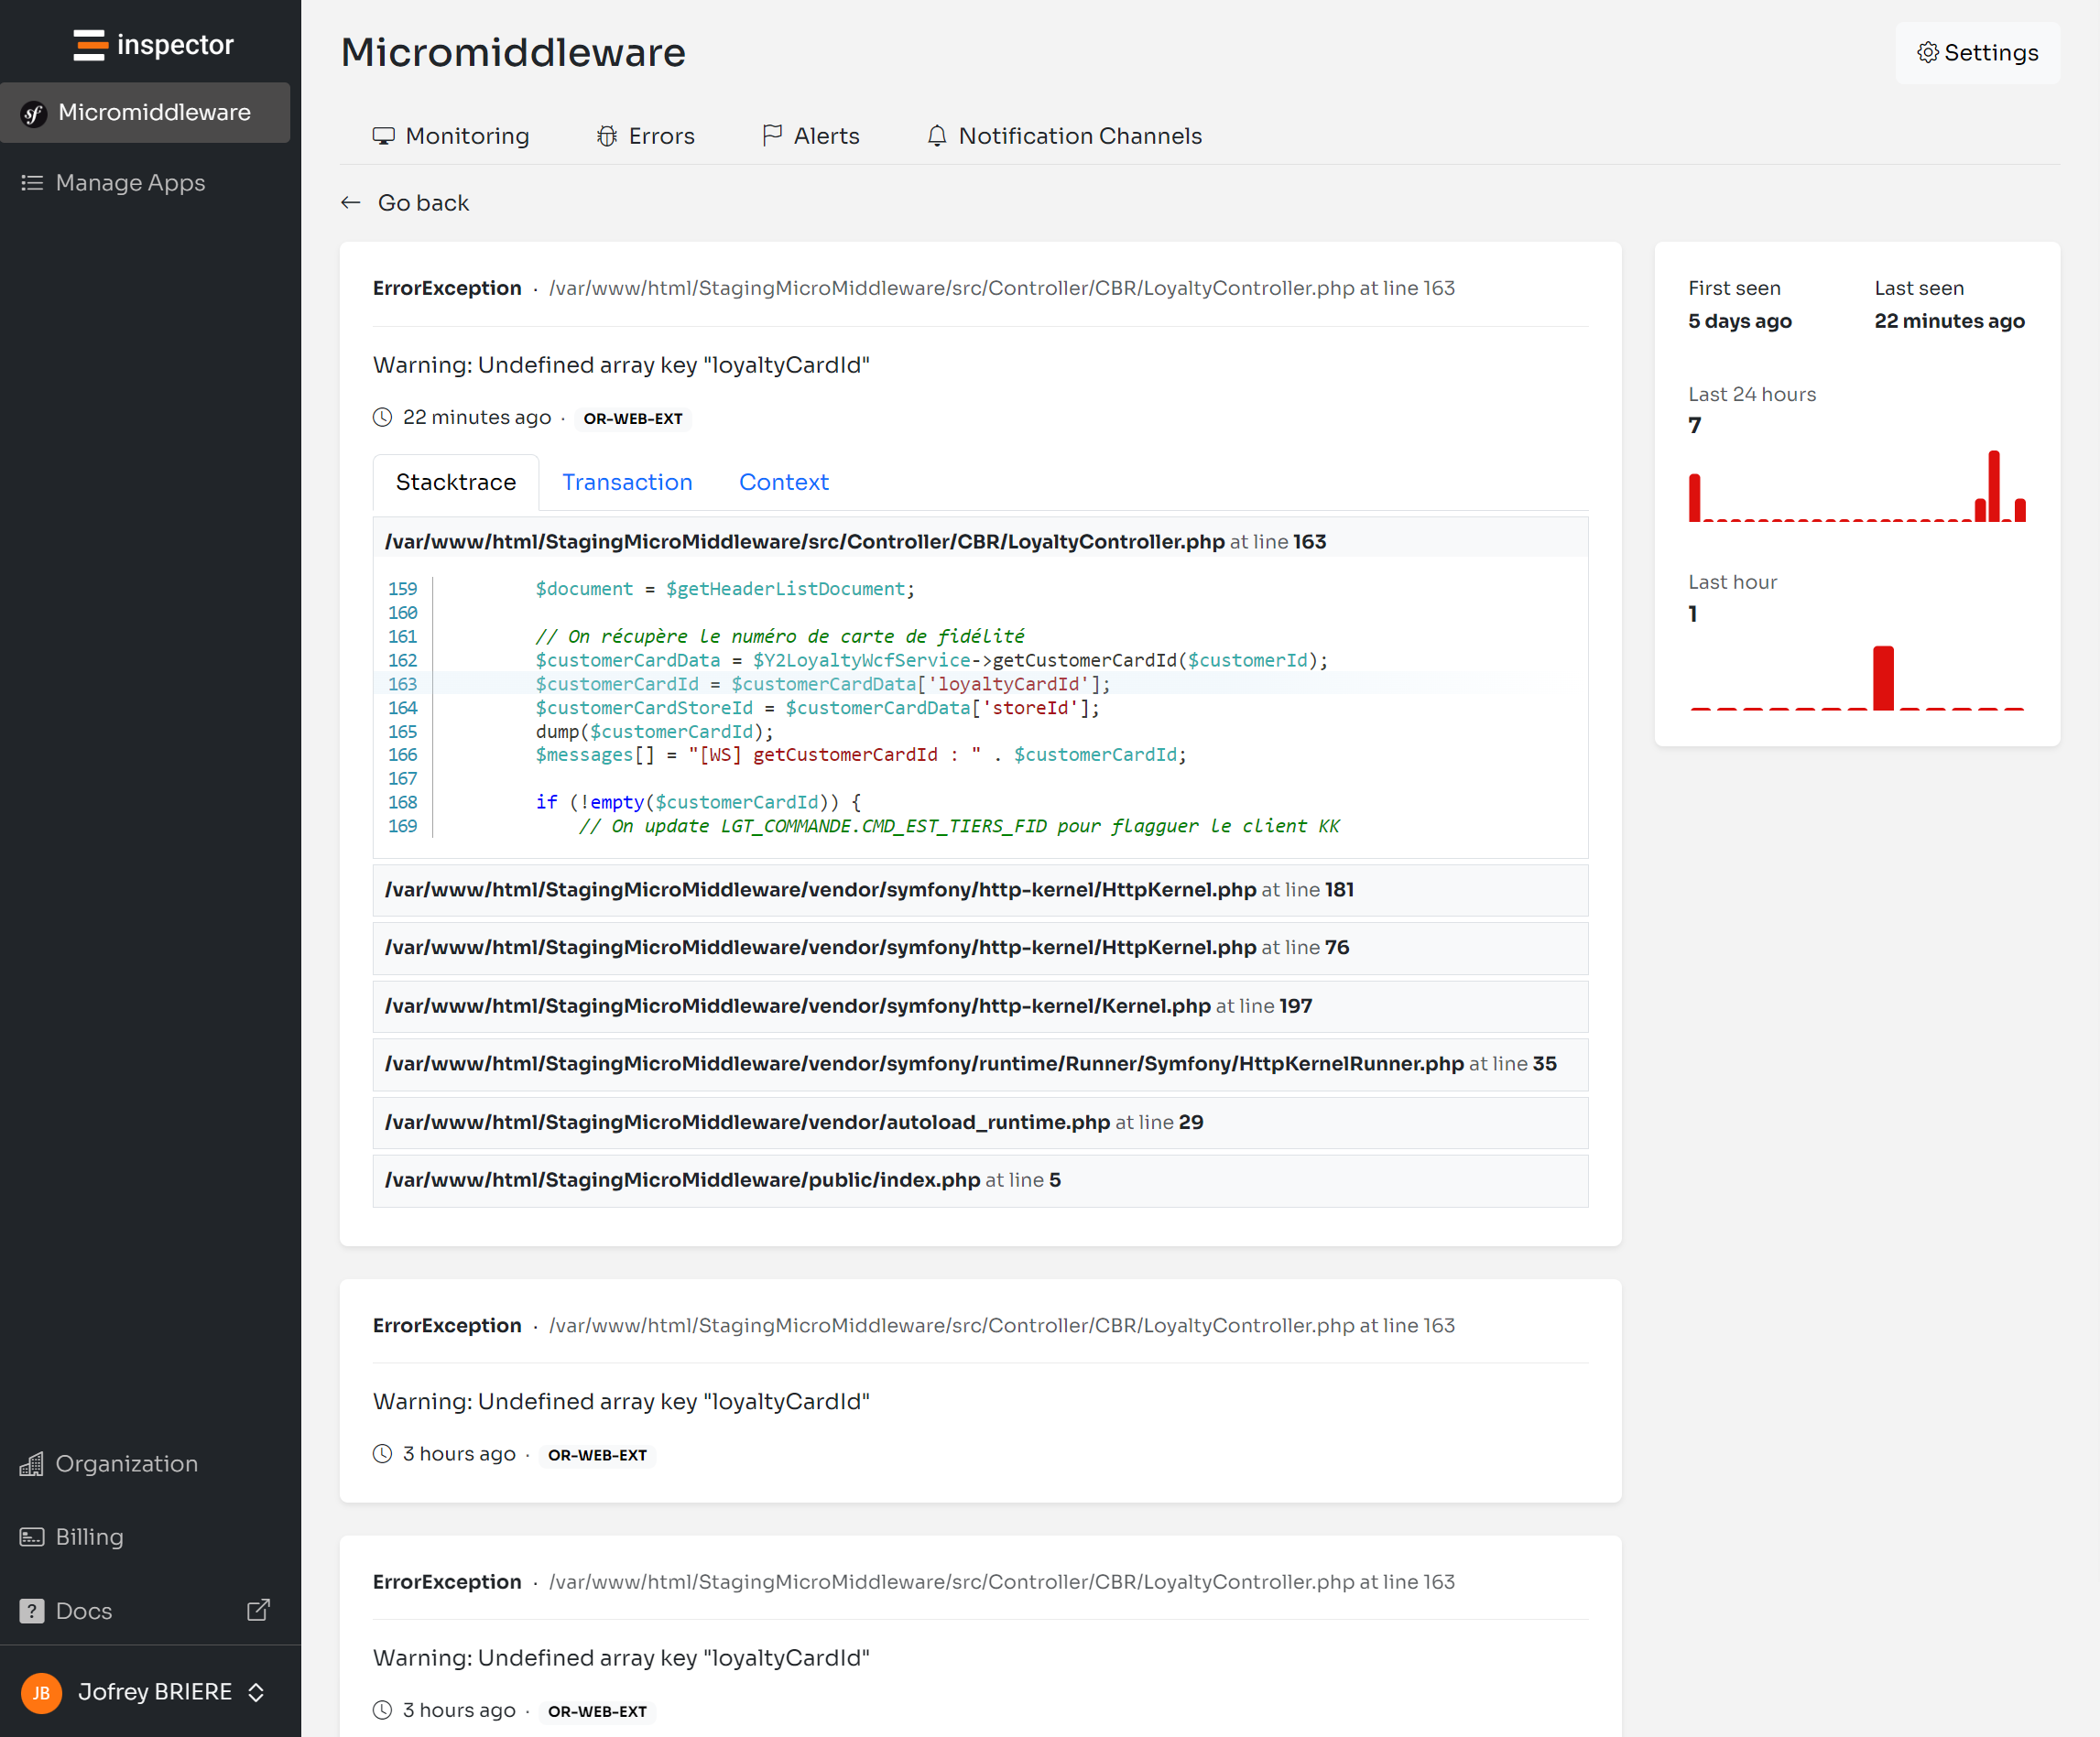
Be informed of unpredictable errors in real-time. You can save hours or even days to identify a problem and design the appropriate solution.
Reduce negative impacts on your customer base, and protect your business from disruptive events.
Find out what your ORM does behind the scenes, and identify slow database queries in real time.
Get detailed insights to fix slow-performing tasks immediately before they become a problem.
We help companies just like yours grow their software business with confidence
Leverage built-in integrations or use extensible APIs and webhooks to easily integrate with the upstream and downstream applications in your tech stack.