Symfony Profiler is a powerful tool for debugging and optimizing Symfony applications. It provides detailed insights into web requests, logs, routing, cache, performance metrics, and more. Here’s what you need to know:
-
Key Features:
- Analyze performance: Spot bottlenecks in execution time and memory usage.
- Debug with ease: Examine variables, objects, and logs in real-time.
- Monitor resources: Track database queries, cache operations, and rendering times.
-
Setup in Minutes:
-
Install via Composer:
composer require --dev symfony/profiler-pack -
Configure settings in
web_profiler.yamlto enable the Web Debug Toolbar and profiler dashboard. - Use built-in or custom data collectors to monitor specific metrics.
-
Install via Composer:
-
Optimization Tips:
- Fix slow SQL queries (e.g., N+1 problems) and optimize templates.
- Use tools like Inspector for deeper performance analysis.
Important: Always disable the profiler in production to avoid security risks. Profiles automatically expire after 48 hours to keep debugging data manageable.
Whether you’re troubleshooting issues or improving performance, Symfony Profiler is an essential tool for Symfony developers.
Setup Guide
Installation Steps
To get started, install the profiler package using Composer:
composer require --dev symfony/profiler-pack
This command will add the WebProfilerBundle and its dependencies to your project, automatically setting them up for development use.
System Requirements:
| Requirement | Details |
|---|---|
| PHP Version | 7.4 or higher |
| Symfony Version | 4.4 or higher |
| Environment | Development or Test only |
| Storage | At least 50MB free space |
Basic Configuration
Follow these steps to configure the profiler for efficient and secure usage:
-
Set Environment
Update theconfig/packages/dev/web_profiler.yamlfile with the following settings:web_profiler: toolbar: true intercept_redirects: false framework: profiler: collect: true collect_parameter: '_profiler' -
Security Adjustments
To ensure the profiler is disabled in production, modify your production configuration:web_profiler: toolbar: false intercept_redirects: false framework: profiler: false -
Storage Settings
Define where profiler data will be stored by editingconfig/packages/dev/framework.yaml:framework: profiler: dsn: 'file:%kernel.project_dir%/var/cache/profiler'
Once these configurations are in place, you can move on to setting up data collectors for more detailed monitoring.
Data Collector Setup
After completing the basic setup, you can enable and customize data collectors to gather application-specific data.
-
Enable Built-in Collectors
Symfony comes with several built-in collectors to track:- Request/Response data
- Route details
- Logger messages
- Database queries
- Cache operations
-
Create a Custom Collector
If needed, you can implement your own data collector by following this example:<?php use Symfony\Component\HttpKernel\DataCollector\DataCollector; class CustomCollector extends DataCollector { public function collect(Request $request, Response $response, \Throwable $exception = null) { $this->data = [ 'custom_metric' => $this->getCustomMetric(), ]; } public function reset() { $this->data = []; } public function getName(): string { return 'app.custom_collector'; } } ?>The
collect()method runs once per request, capturing the metrics you define.
For best results, configure your collectors to monitor only the metrics that are most relevant to your application’s performance.
Using the Interface
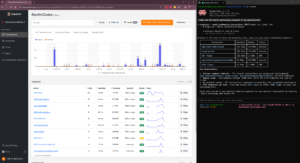
Debug Toolbar Overview
The Web Debug Toolbar sits at the bottom of your browser window, giving you quick access to essential debugging information. It shows key metrics like:
| Metric | Description | Quick Access |
|---|---|---|
| Route | Current route name and matched controller | View full routing details |
| Response Time | Page load time in milliseconds | Performance breakdown |
| Memory Usage | Real-time memory usage | Expandable allocation details |
| Database | Number of executed queries | Analyze queries directly |
| Templates | Rendered Twig templates | Jump to template profiling |
Click on any of these metrics to open a detailed dashboard for deeper insights.
Main Dashboard Functions
The Profiler dashboard builds on the toolbar metrics, offering more in-depth tools like:
- Exception Handling: Access complete stack traces and error details, including related variables and the full error chain.
- API Platform Integration: For API-heavy applications, view resource configurations, serialization groups, applied filters, and authentication details.
Reading Performance Data
Inside the dashboard, you can explore detailed performance metrics:
- Timeline Analysis: A chronological view of controller execution times, query durations, and template rendering periods.
- Memory Profiling: Dive into detailed memory allocation data.
"The debug toolbar is only injected into HTML responses. For other content types, the profiler URL is available in the
X-Debug-Token-LinkHTTP response header".
For non-HTML responses, you can find the profiler URL in the X-Debug-Token-Link header or go to /_profiler using the debug token.
To keep things running smoothly, the profiler automatically deletes profiles older than 48 hours, ensuring it retains only recent debugging data.
sbb-itb-f1cefd0
Performance Optimization
Symfony Profiler helps you spot areas where your application’s performance can be improved. Here’s how to make your code run more efficiently.
Finding Performance Issues
The Timeline panel in Symfony Profiler shows execution metrics that help you identify bottlenecks. Keep an eye on key metrics like request duration, memory usage, database queries, and template rendering times. If you notice any spikes, it’s time to dig deeper: review your controller logic, look for memory leaks, optimize your database queries, or simplify templates. You can also use the Stopwatch component to pinpoint specific performance issues.
Once you’ve tackled these, focus on improving your database performance.
SQL Query Improvements
A fast database is essential for a responsive application. The Doctrine Debug Toolbar is a great tool for identifying common database issues. Here are two common problems and how to fix them:
-
N+1 Query Problems
This happens when your code runs too many database queries. Here’s an example:
Inefficient:$users = $entityManager->getRepository(User::class)->findAll(); foreach ($users as $user) { echo $user->getProfile()->getBio(); }Optimized:
$query = $entityManager->createQuery( 'SELECT u, p FROM App\\Entity\\User u JOIN u.profile p' ); $users = $query->getResult(); -
Batch Processing
When working with large datasets, batch processing can help manage memory usage:$batchSize = 20; for ($i = 1; $i <= 1000; ++$i) { $user = new User(); $user->setName('User ' . $i); $entityManager->persist($user); if (($i % $batchSize) === 0) { $entityManager->flush(); $entityManager->clear(); } }
Template Performance
After optimizing your database, you can improve how your templates render. Here are some tips:
- Enable Cache: Turn on Twig’s compilation cache in production to speed up template processing.
- Simplify Template Inheritance: Avoid deeply nested templates, as they can slow down rendering.
-
Use Partial Rendering: For cacheable sections, consider using
render_esi()to boost response times.
For ongoing monitoring, consider integrating Inspector (https://inspector.dev). This tool gives you a dashboard to track slow-rendering templates in real time, making it easier to identify areas that need attention.
Advanced Tools
Once performance optimization is underway, advanced tools can help with tailored profiling and precise timing.
Building Data Collectors
You can create custom data collectors to track specific metrics by extending Symfony’s built-in profiler. To build one, extend the DataCollector class and implement methods like collect(), reset(), and getName():
use Symfony\Component\HttpKernel\DataCollector\DataCollector;

class CustomDataCollector extends DataCollector {
    public function collect(Request $request, Response $response, \Throwable $exception = null) {
        $this->data = [
            'metric_name' => $this->getMetricValue(),
        ];
    }

    public function reset()
    {
        $this->data = [];
    }

    public function getName(): string
    {
        return 'app.custom_collector';
    }
}
To display the collected data, define three Twig blocks: toolbar, menu, and panel:
{% block toolbar %}
    {# Debug toolbar content #}
{% endblock %}

{% block menu %}
    {# Profiler menu item #}
{% endblock %}

{% block panel %}
    {# Detailed panel content #}
{% endblock %}
Stopwatch Usage
The Symfony Stopwatch component is a quick way to measure execution time and memory usage. Start by installing it via Composer:
composer require symfony/stopwatch
Here’s how to measure code execution time:
use Symfony\Component\Stopwatch\Stopwatch;

$stopwatch = new Stopwatch(true);

// Start timing
$stopwatch->start('database-query');

// Your code here
$result = $repository->findAll();

// Stop and get event details
$event = $stopwatch->stop('database-query');
$duration = $event->getDuration(); // in milliseconds
$memory = $event->getMemory(); // in bytes
For more complex workflows, you can group related events into sections:
$stopwatch->openSection('critical-path');
// Multiple events here
$stopwatch->stopSection('critical-path');
These tools are a great way to dig deeper into performance bottlenecks.
Summary
Key Benefits Review
Symfony Profiler offers measurable improvements in various areas of application performance:
| Optimization Area | Typical Improvement | Implementation Complexity |
|---|---|---|
| Database Queries | 30-50% faster | Medium |
| Full Page Cache | Up to 80% faster | Low |
| Production Settings | 20-30% improvement | Low |
| Code Efficiency | 25-40% increase | High |
| Asset Loading | 40-60% faster | Medium |
Its built-in tools help pinpoint bottlenecks and improve application performance. However, there’s one critical security reminder:
"Never enable the profiler in production environments as it will lead to major security vulnerabilities in your project." – Symfony Documentation
These improvements provide a strong starting point for optimizing your application.
Further Learning Steps
To make the most of Symfony Profiler, consider these next steps:
Custom Data Collection
Create custom collectors to track metrics specific to your application.
Performance Measurement
Incorporate tools like the Stopwatch component or Inspector (https://inspector.dev) for live performance tracking.
Security Best Practices
Follow these steps to safeguard your environment:
- Limit access to the development environment to specific IPs
- Regularly update packages to keep them secure
- Enable the profiler only under specific, controlled conditions
For more detailed performance monitoring, Inspector (https://inspector.dev) can help you track HTTP traffic, slow SQL queries, background tasks, and errors, while also providing actionable fixes.