Real-time error tracking and log analysis are two essential methods for monitoring web applications. Here’s a quick breakdown:
-
Real-Time Error Tracking: Identifies and alerts you about errors as they happen. Ideal for high-stakes, time-sensitive applications like e-commerce or healthcare systems.
- Key Features: Instant alerts, error grouping, integration with development tools, and performance metrics.
- Best For: Quickly resolving urgent issues in complex or high-traffic systems.
-
Log Analysis: Examines historical data to find trends, diagnose issues, and improve performance over time.
- Key Features: Historical data analysis, unified log management, advanced search, and compliance tracking.
- Best For: Debugging distributed systems, enhancing security, and performance tuning.
Quick Comparison
| Feature | Real-Time Error Tracking | Log Analysis |
|---|---|---|
| Reaction Speed | Immediate alerts | Delayed but deeper insights |
| Data Focus | Current errors and stack traces | Historical and system-wide data |
| Resource Needs | Lightweight | Requires more storage and processing |
| Use Cases | High-traffic, time-sensitive apps | Complex, distributed systems |
| Retention | Short-term error data | Long-term historical records |
For the best results, combine both methods to catch immediate issues while gaining long-term insights.
Understanding Real-Time Error Tracking
What Real-Time Error Tracking Does
Real-time error tracking identifies and analyzes errors as they happen. It automatically detects and reports issues in production, gathering crucial details like stack traces, server environment data, and user session information. This helps developers quickly understand and resolve problems.
Main Features and Benefits
These platforms come with tools designed to keep applications running smoothly:
| Feature | How It Helps |
|---|---|
| Instant Alerts | Notifies teams immediately when errors occur |
| Error Grouping & Context | Combines similar issues and provides stack traces to speed up debugging |
| Development Integration | Connects directly to issue trackers and communication tools for seamless workflows |
| Performance Metrics | Delivers real-time data on application health and stability |
When to Use Real-Time Error Tracking
Real-time error tracking is crucial for applications where reliability is non-negotiable:
High-Stakes Applications
- Financial trading platforms where errors could cause monetary losses
- Healthcare systems where functionality impacts patient outcomes
- E-commerce sites where downtime translates to lost sales
Complex Systems
It’s especially useful for applications with:
- Microservice architectures
- Heavy traffic loads
- Sensitive user data
- Numerous integration points
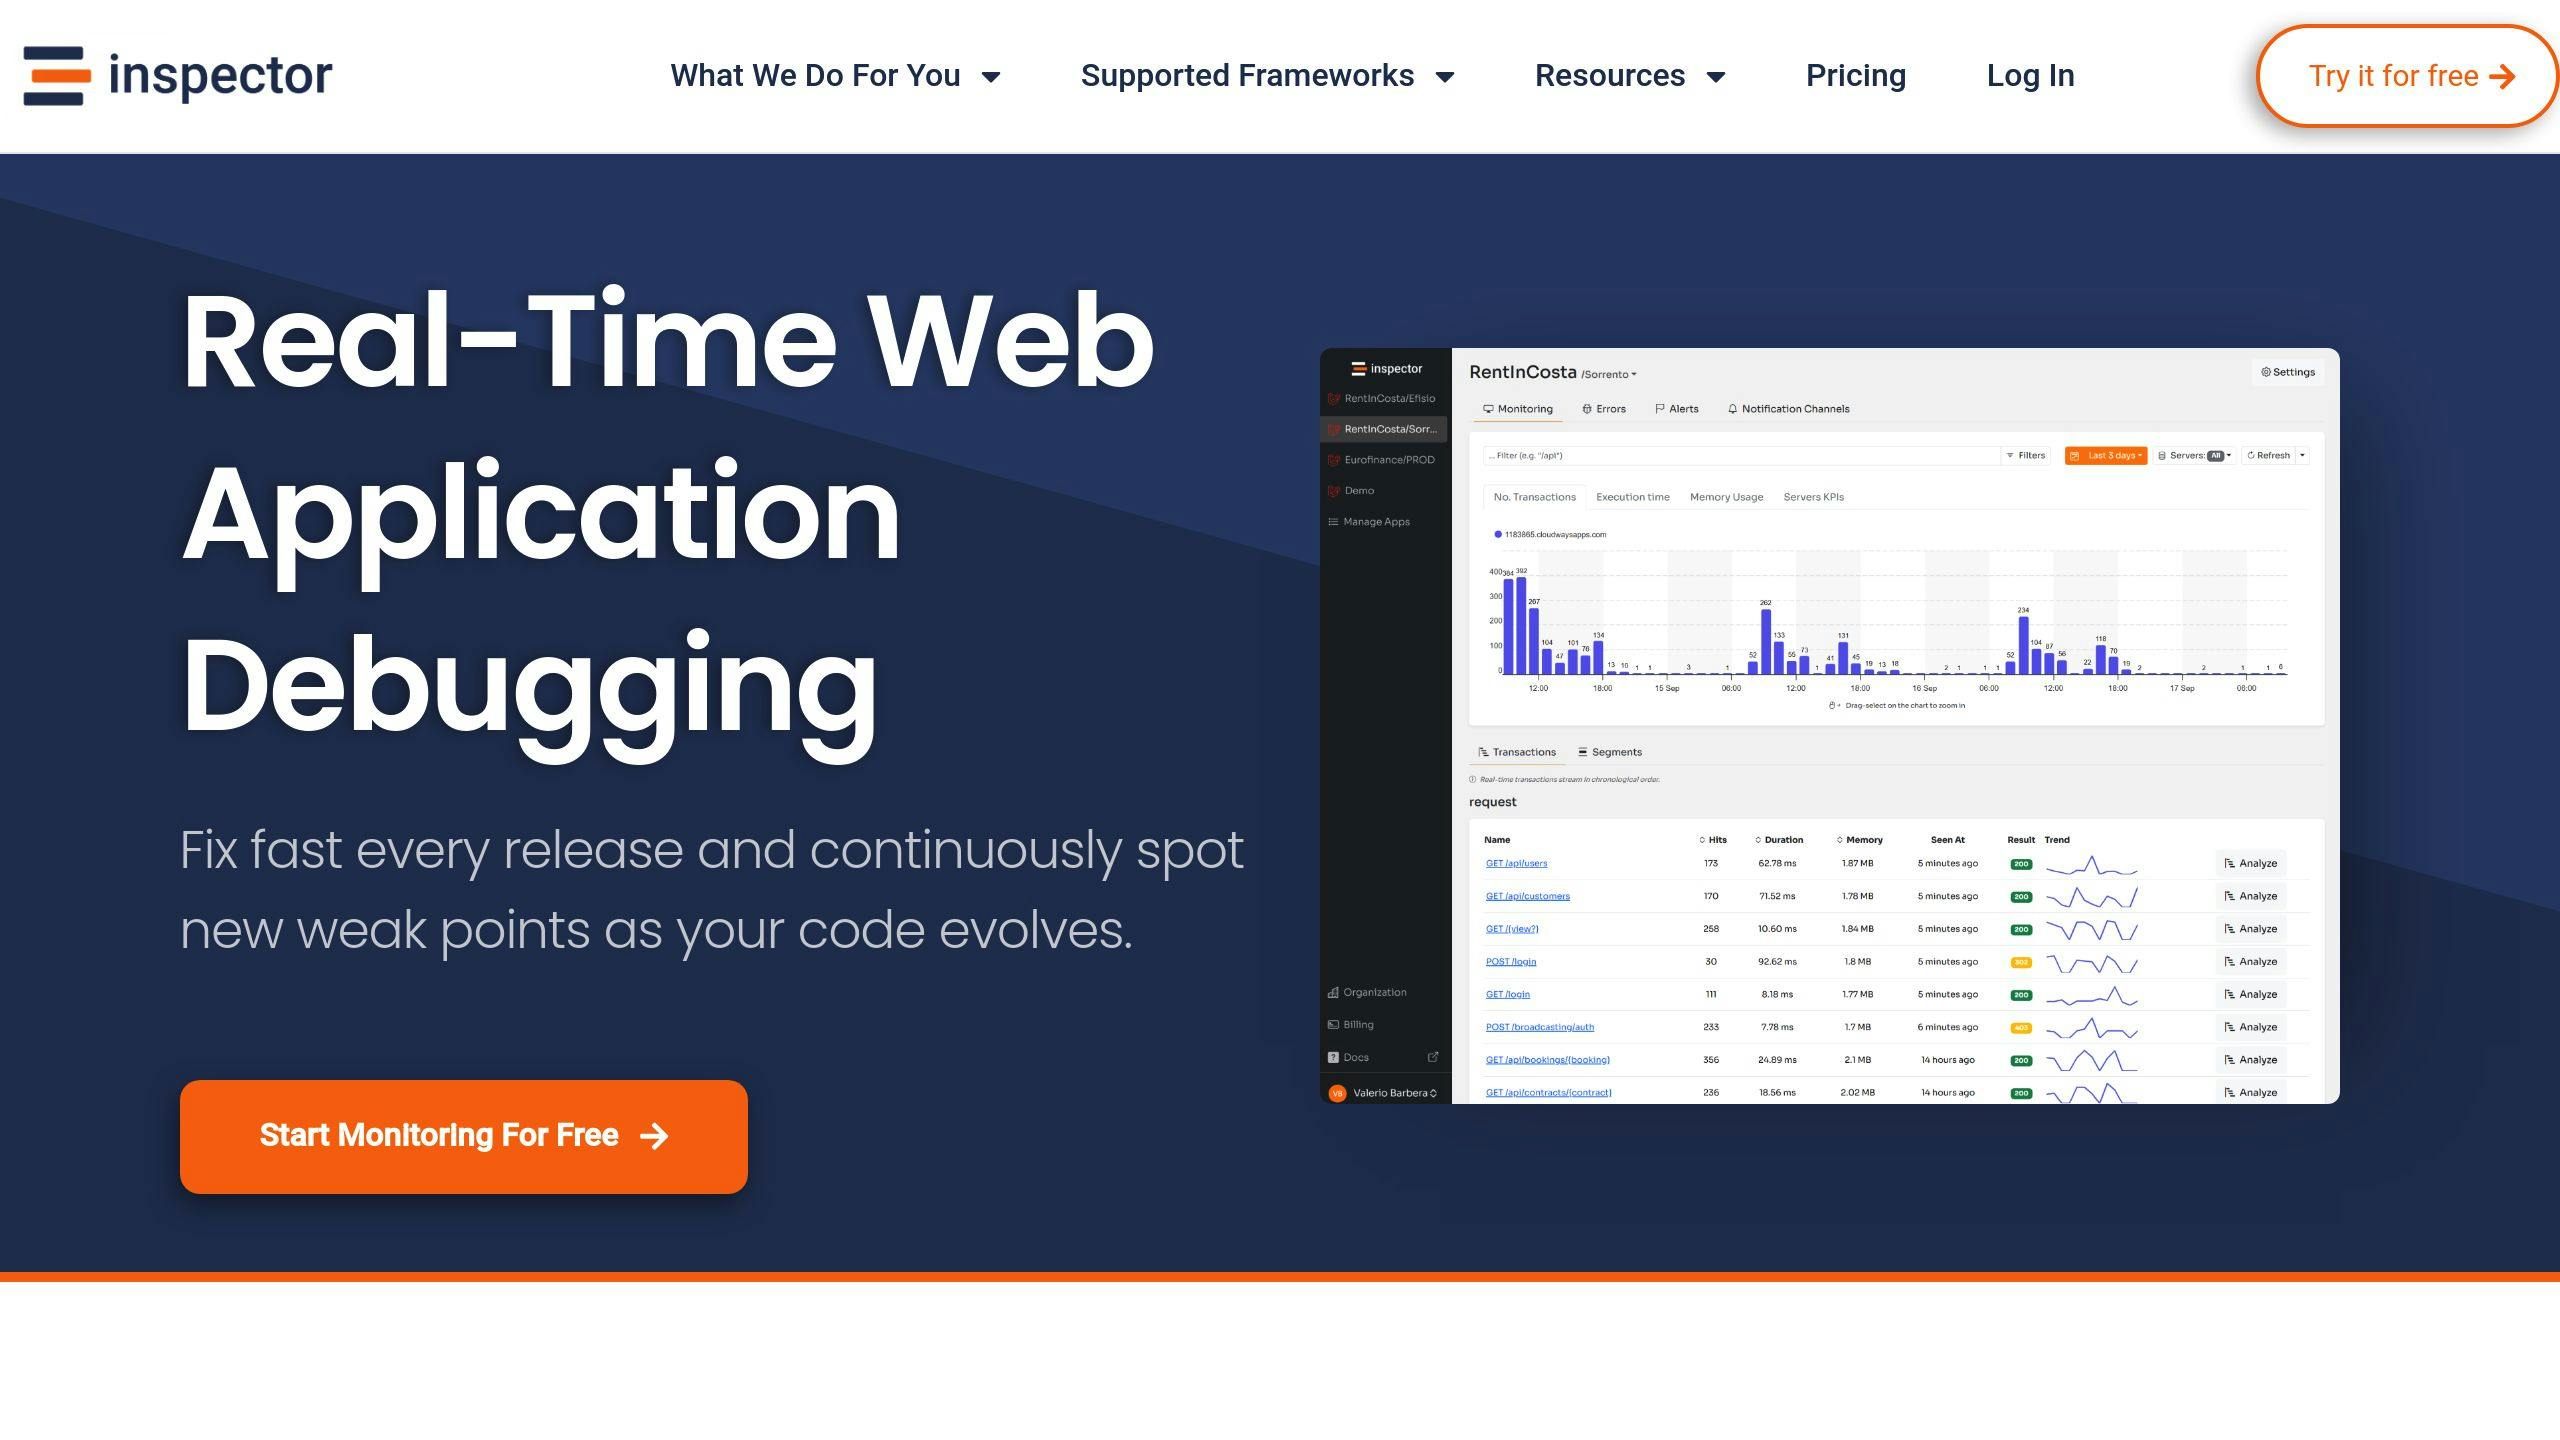
Platforms like Inspector automatically group similar errors, helping teams focus on the most critical issues. This instant detection minimizes the risk of small errors escalating into larger problems.
While real-time error tracking is great for spotting immediate issues, pairing it with log analysis offers a more complete monitoring setup. Real-time tracking handles urgent problems, while log analysis provides deeper insights for long-term improvements.
Explaining Log Analysis
What Log Analysis Is
Unlike real-time error tracking, which focuses on resolving immediate issues, log analysis digs into historical data to reveal long-term patterns, diagnose problems, and improve performance. By examining logs over time, it provides a deeper look into system behavior. Tools like Loggly and Dynatrace make this process easier by centralizing logs and offering tools for parsing and visualizing data.
Now that we’ve covered the basics, let’s break down the key features and what they bring to the table for web applications.
Features and Benefits of Log Analysis
| Feature | Benefit | Use Case |
|---|---|---|
| Historical Data Analysis | Tracks patterns and trends over time | Ideal for capacity planning and fine-tuning |
| Unified Log Management | Combines logs from various sources | Simplifies debugging in distributed systems |
| Advanced Search | Speeds up issue identification | Pinpoints problems in massive datasets |
| Custom Alerts & Compliance | Flags unusual activity and tracks audits | Prevents downtime and ensures regulations |
By identifying vulnerabilities early, log analysis minimizes risks and avoids costly disruptions.
When Log Analysis Shines
There are specific scenarios where log analysis becomes indispensable:
Debugging Complex Systems: In distributed systems, it connects the dots between events across components, making it easier to find the root cause of issues.
Security and Compliance: Log analysis enhances security by spotting threats and maintaining detailed audit trails. For example, a Splunk survey found that 60% of IT professionals rely on log analysis for these purposes.
Performance Tuning: Logs reveal areas for performance improvement, helping teams address potential problems before they escalate.
Using centralized log systems and setting up proper retention policies ensures you get the most out of log analysis.
Comparing Real-Time Error Tracking and Log Analysis
Strengths and Weaknesses of Each Method
Deciding between real-time error tracking and log analysis requires understanding their unique features. Here’s a side-by-side look at what each method offers:
| Feature | Real-Time Error Tracking | Log Analysis |
|---|---|---|
| Reaction Speed | Instant detection and alerts | Delayed insights but with deeper analysis |
| Depth of Analysis | Focused on current errors and stack traces | Covers historical and system-wide data |
| Resource and Cost Needs | Lightweight with minimal setup | Requires more storage and processing power |
| Best Use Cases | Ideal for high-traffic, time-sensitive apps | Suited for complex, distributed systems |
| Data Retention | Short-term error data | Long-term historical records |
| Hybrid Potential | Detects issues immediately | Complements with historical analysis |
Each method has its strengths. The choice largely depends on the specific requirements of your application and infrastructure.
Choosing the Right Monitoring Method
Application Complexity
Real-time error tracking works best for high-traffic apps where quick error detection is crucial. For instance, tools like Rollbar have proven effective in identifying and fixing PHP errors swiftly, helping to minimize downtime.
Resource and Infrastructure Needs
Real-time tracking is straightforward to deploy and consumes fewer resources. On the other hand, log analysis requires more robust storage and processing, especially for managing logs across distributed systems.
Advantages of a Combined Approach
Using both methods together can offer the most comprehensive monitoring. This approach allows you to:
- Address errors immediately while analyzing long-term trends
- Keep detailed logs for compliance purposes
- Allocate resources more effectively based on historical patterns
Security and Performance
Proper configuration is key. Real-time tracking tools need to protect sensitive information, while log analysis systems must handle large datasets efficiently [3].
sbb-itb-f1cefd0
Summary and Suggestions
Key Takeaways
Real-time tracking focuses on catching and addressing errors as they happen, while log analysis looks at the bigger picture, offering insights over time. Together, these methods cover different needs in web application monitoring. Real-time tracking is ideal for critical applications that need quick action, while log analysis is better suited for understanding long-term patterns and improving security or performance.
Here’s how you can make the most of both approaches.
Practical Tips
Integration Plan
- Use real-time tracking to catch issues instantly and log analysis to gain deeper, long-term insights.
-
Adjust error reporting levels in
php.inito ensure you’re capturing the right data.
Efficient Resource Use
Centralize your logs, automate fixes with tools like Inspector, and focus on processing real-time errors first.
Tools and Resources for Monitoring
Once you’re familiar with the benefits of real-time error tracking and log analysis, it’s time to look at tools that can put these methods into action.
Inspector for Real-Time PHP Monitoring

Inspector is designed specifically for web application monitoring, offering features that cater to modern stack. It provides monitoring capabilities without requiring a complicated setup.
Here’s what it brings to the table:
| Feature | Description | Why It Matters |
|---|---|---|
| HTTP Traffic Monitoring | Tracks HTTP requests live | Helps pinpoint performance issues |
| SQL Query Detection | Flags slow database queries | Improves database efficiency |
| Task Monitoring | Monitors asynchronous processes | Ensures smooth operations |
| AI-powered Debugging | Recommends automated fixes | Speeds up problem-solving |
Inspector is budget-friendly and works well for teams of all sizes. Next, let’s dive into some common questions about monitoring.
FAQs
What is the difference between a trace and a log?
When monitoring web applications, it’s important to know how tracing and logging differ. Here’s a quick breakdown:
| Aspect | Tracing | Logging |
|---|---|---|
| Timing | Follows the entire journey of a request through the system | Captures specific moments in time |
| Context | Offers a system-wide perspective | Focuses on individual events |
| Data Captured | Tracks request paths and timing between components | Records event details and error messages |
Tracing is useful for tracking how requests flow through frameworks like Laravel, while logging is better for capturing runtime errors or database issues. For instance, tracing can show the path a request takes through your middleware stack, while logs might pinpoint a failed database query.
Tools like Inspector bring together both tracing and logging for PHP applications. Here’s how they work together:
- Tracing: Maps out request paths and interactions across the system to identify bottlenecks and improve performance.
- Logging: Provides detailed records of events, perfect for debugging and audits.
- Combined Approach: Using both ensures you get a complete view of your application’s behavior and performance.


