It is getting harder to filter through the noise in our industry right now. New AI tools drop every day, and navigating the hype cycle can be exhausting. But the reality is that our day-to-day job as developers is changing.
Most of us have already integrated AI agents (like Claude, Cursor, or Copilot) into our workflow to write boilerplate or refactor logic. But there is still a massive disconnect in other part of the process: The “Context Gap.”
Your AI assistant knows your code (static analysis), but it doesn’t know how your application is actually behaving in production (runtime data).
Until now, fixing a production bug usually meant:
- Leaving the IDE.
- Logging into your monitoring dashboard.
- Searching for the transaction or error.
- Copying the stack trace or SQL query.
- Pasting it back into the AI chat.
- Asking: “Given this error and this code, what’s wrong?”
This is context switching. It breaks flow, it creates fatigue, and frankly, it’s inefficient.
Bridging the gap
We built the Inspector MCP Server to remove that manual data transfer.
If you aren’t familiar with it, MCP (Model Context Protocol) is an open standard that allows AI models to connect to external tools safely. We have exposed Inspector’s data via MCP so your coding agent can read your application’s monitoring data directly.
This enables what I call “Zero-UI Observability.” You don’t need to visit the Inspector dashboard UI to understand what is happening. You can stay in your terminal or IDE and let the agent fetch the context it needs.
What this looks like in practice
Instead of manually correlating logs with code, you can treat your monitoring data as a queryable resource within your development environment. You stay in the flow, the AI gets the ground truth, and the “investigation” phase of a bug fix shrinks from twenty minutes of tab-switching to a single natural language query.
The agent can pull:
- Real-time error lists and stack traces.
- Bug analysys and fix proposal generated by our agentic system
- Performance metrics for specific endpoints.
- Database query timelines.
Because the AI sees the exact exception payload from production alongside your local source code, the suggestions for fixes become significantly more accurate. It moves the workflow from “Guess and Check” to “Analyze and Fix.”
Try it out
We have kept the setup minimal. You just need to add the Inspector MCP server to your agent configuration (VS Code, Cursor, or Claude Desktop).
View the setup documentation here
You can find the commands for connecting the most common coding agents. Once connected, you don’t need to explain the context to the AI. You can just ask:
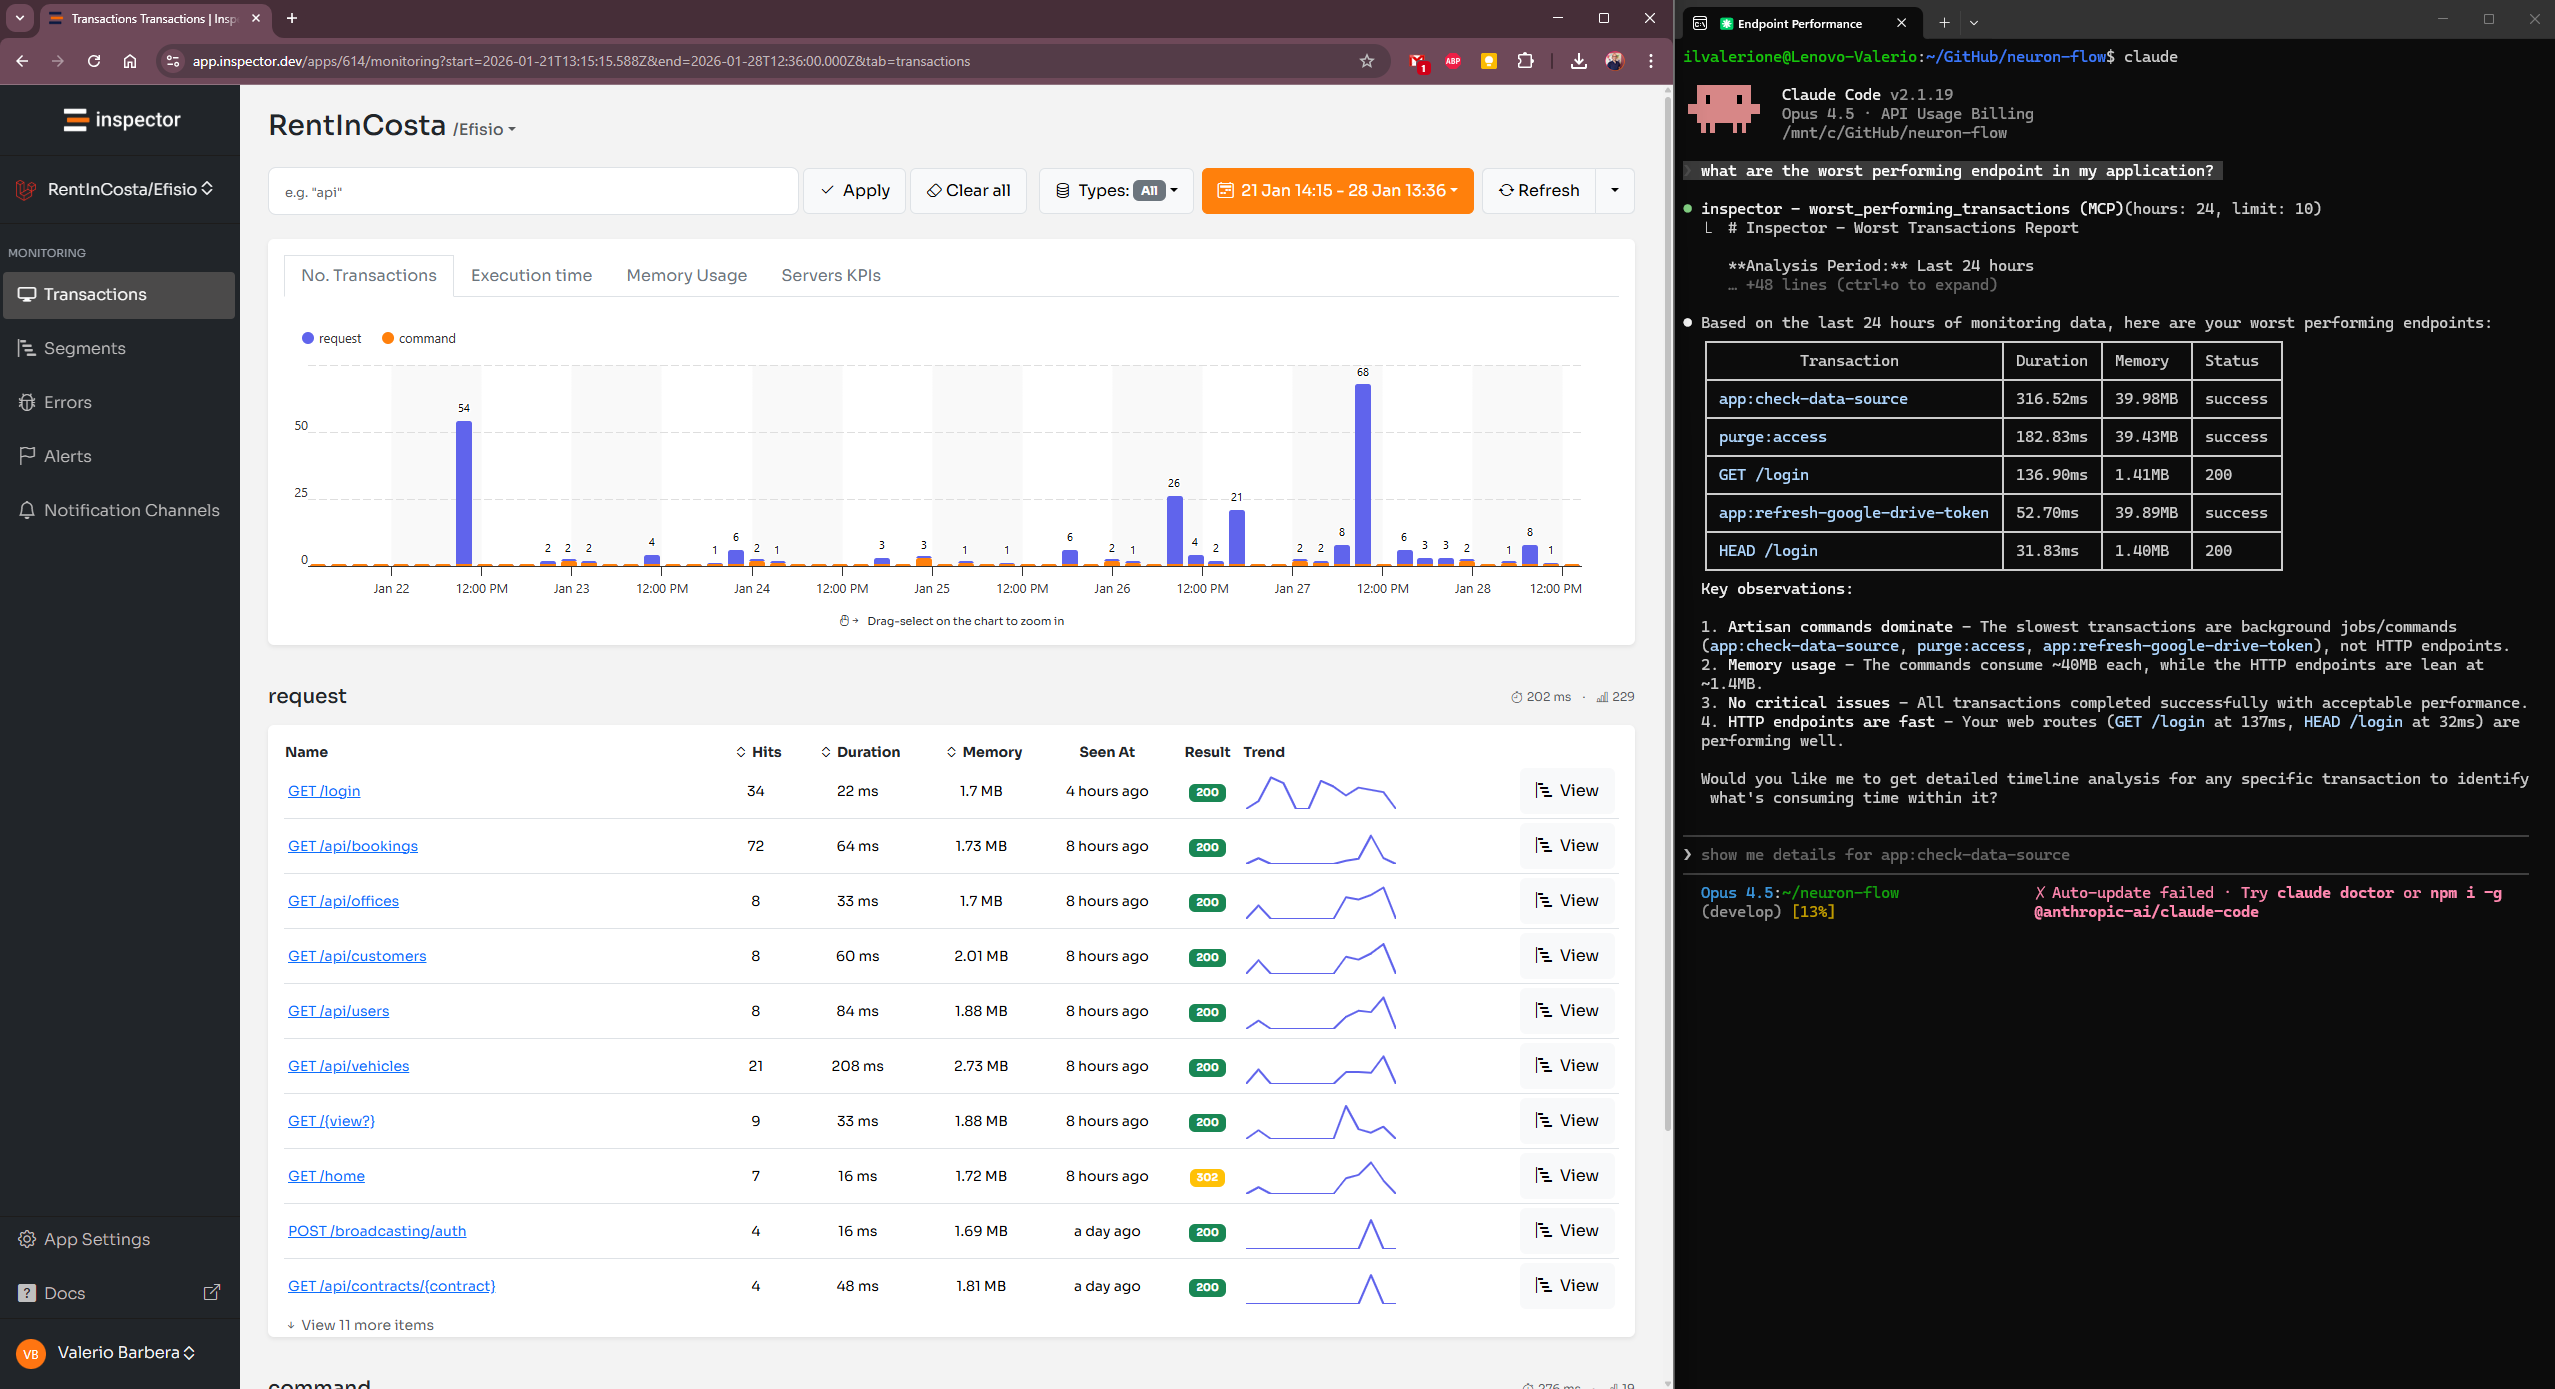
“What are the worst performing endpoints in my application?”
Or, if you are tackling a bug:
“Analyze the stack trace of the last 5 errors and suggest a fix.”
I believe this is a more sustainable way to work—keeping the focus on the code, not the tools. Let me know if it helps your workflow.